International accounts for 2016 (final data) – all analytical comments
According to final data, in 2016, the current account of the balance of payments recorded a deficit of US$ 285.58 million (down by 38.9 percent as compared to 2015), the capital account registered a deficit of US$ 20.79 million and the financial account recorded a net inflow of US$ 214.56 million. The international investment position of the Republic of Moldova remained net debit totaling US$ -3,550.57 million at the end of 2016, while the gross external debt of the Republic of Moldova reached US$ 6,235.23 million.
Table 1. Main macroeconomic indicators of the Republic of Moldova
|
|
2012
|
2013
|
2014
|
2015
|
2016
|
|
Gross domestic product in current prices, MDl mil.
|
88,228
|
100,510
|
112,050
|
122,563
|
134,937
|
|
Gross domestic product in current prices, US$ mill.
|
7,284
|
7,983
|
7,981
|
6,514
|
6,773
|
|
GDP, physical volume indices, %
|
99.3
|
109.4
|
104.8
|
99.6
|
104.3
|
|
Exports of goods, physical volume indices, %
|
101
|
113
|
102
|
101
|
107.7
|
|
Exports of goods, unit value indices, %
|
97
|
98
|
94
|
83
|
96.5
|
|
Imports of goods, physical volume indices, %
|
101
|
106
|
101
|
95
|
107.6
|
|
Imports of goods, unit value indices, %
|
99
|
99
|
96
|
79
|
93.7
|
|
Terms of trade, %
|
98.0
|
99.0
|
97.9
|
105.1
|
103.0
|
|
Period average exchange rate, MDL/USD
|
12.1122
|
12.5907
|
14.0388
|
18.8161
|
19.9238
|
|
Personal remittances / GDP, %
|
25.2
|
25.9
|
24.6
|
22.3
|
20.3
|
|
FDI flows (net incurrence of liabilities) / GDP, %
|
3.4
|
3.0
|
4.3
|
3.3
|
1.3
|
Sourses: NBM, NBS
Table 2. Contribution of the main components to the evolution of the BOP current account(BPM6)
|
|
2012
|
2013
|
2014
|
2015
|
2016
|
2016/2015
Contribution
|
|
% to GDP
|
p. p.
|
|
Current account
|
-8.8
|
-6.1
|
-7.1
|
-7.2
|
-4.2
|
3.0
|
|
Trade balance
|
-40.6
|
-37.4
|
-36.6
|
-30.7
|
-27.6
|
3.1
|
|
Exports of goods and services
|
37.2
|
38.1
|
37.1
|
38.1
|
38.3
|
0.2
|
|
Imports of goods and services
|
77.8
|
75.5
|
73.7
|
68.7
|
65.9
|
-2.8
|
|
Primary income balance
|
11.1
|
11.2
|
10.3
|
6.9
|
6.8
|
-0.1
|
|
Primary income inflow, of which:
|
14.4
|
14.6
|
14.0
|
12.5
|
11.0
|
-1.5
|
|
Compensation of employees
|
13.9
|
14.0
|
13.3
|
12.0
|
10.5
|
-1.5
|
|
Primary income outflow, of which:
|
3.3
|
3.4
|
3.7
|
5.6
|
4.2
|
-1.4
|
|
Investment income
|
2.6
|
2.8
|
2.8
|
4.4
|
3.2
|
-1.2
|
|
Сальдо вторичных доходов
|
20.7
|
20.0
|
19.2
|
16.6
|
16.6
|
0.0
|
|
Secondary income inflow, of which:
|
22.3
|
21.7
|
21.0
|
18.8
|
18.4
|
-0.4
|
|
Personal transfers
|
13.4
|
13.4
|
12.7
|
11.6
|
11.1
|
-0.5
|
|
Current international cooperation
|
3.5
|
3.2
|
4.4
|
3.0
|
3.2
|
0.2
|
|
Secondary income outflow
|
1.6
|
1.7
|
1.9
|
2.2
|
1.8
|
-0.4
|
|
Capital account
|
0.3
|
1.3
|
1.8
|
0.8
|
-0.3
|
-1.1
|
|
Net borrowing (current and capital account balance)
|
-8.5
|
-4.8
|
-5.3
|
-6.3
|
-4.5
|
1.8
|
*percentage points
Table 3. Sources of coverage for the net borrowing, net financial flows, % to GDP
|
|
2012
|
2013
|
2014
|
2015
|
2016
|
2016 / 2015
Contribution
|
|
% to GDP
|
p. p.
|
|
Financial account
|
-7.0
|
-3.7
|
-6.3
|
-7.0
|
-3.2
|
3.9
|
|
Direct investment, of which:
|
-3.1
|
-2.6
|
-3.8
|
-3.2
|
-1.1
|
2.1
|
|
Equity other than reinvestment of earnings
|
-1.7
|
-1.0
|
-1.1
|
-0.4
|
-0.5
|
-0.1
|
|
Reinvestment of earnings
|
0.2
|
0.0
|
-0.5
|
-1.9
|
-1.3
|
0.5
|
|
Debt instruments
|
-1.5
|
-1.6
|
-2.1
|
-0.9
|
0.8
|
1.6
|
|
Portfolio investment and financial derivatives
|
-0.3
|
0.0
|
-0.1
|
-0.1
|
0.0
|
0.1
|
|
Other investment, of which:
|
-10.5
|
-4.6
|
4.3
|
1.0
|
-9.9
|
-10.9
|
|
Currency and deposits
|
-3.4
|
-0.5
|
2.3
|
1.2
|
-5.0
|
-6.2
|
|
Loans
|
-5.4
|
-1.9
|
0.6
|
-0.4
|
-1.8
|
-1.4
|
|
Trade credit and advances
|
-1.7
|
-1.0
|
-3.3
|
0.1
|
-2.6
|
-2.6
|
|
Other accounts receivable / payable
|
0.1
|
-1.2
|
4.6
|
0.1
|
-0.5
|
-0.6
|
|
Change in reserve assets
|
6.8
|
3.5
|
-6.7
|
-4.7
|
7.8
|
12.5
|
Note: (-) – net capital inflow, (+) – net capital outflow
*percentage points
Table 4. Main indicators of the international investment position (BPM6)
|
|
31.12.2012
|
31.12.2013
|
31.12.2014
|
31.12.2015
|
31.12.2016
|
31.12.2016 / 31.12.2015 (%)
|
|
Net international investment position, US$ mill.
|
-3,726.72
|
-3,663.61
|
-3,324.05
|
-3,479.02
|
-3,550.57
|
102.1
|
|
Stock of foreign assets / stock of foreign liabilities, %
|
54.5
|
58.7
|
59.7
|
53.2
|
53.5
|
0.3 p.p.
|
|
Stock of direct investment, liabilities, US$ mill.
|
3,535.09
|
3,472.62
|
3,360.86
|
2,980.08
|
3,037.51
|
101.9
|
|
Share of FDI in the stock of foreign liabilities, %
|
43.1
|
39.1
|
40.7
|
40.1
|
39.7
|
-0.3 p.p.
|
|
Share of loans (without intercompany loans) in the stock of foreign liabilities, %
|
38.3
|
37.6
|
38.3
|
41.2
|
41.1
|
-0.1 p.p.
|
|
Stock of official reserve assets, US$ mill.
|
2,515.00
|
2,820.63
|
2,156.63
|
1,756.81
|
2,205.93
|
125.6
|
|
Stock of reserve assets / Average monthly imports of goods and services (for 12 months), months
|
5.3
|
5.6
|
4.4
|
4.7
|
5.9
|
126.0
|
*percentage points
Chart 1. Indices of reserve assets adequacy, at period-end, US$ million
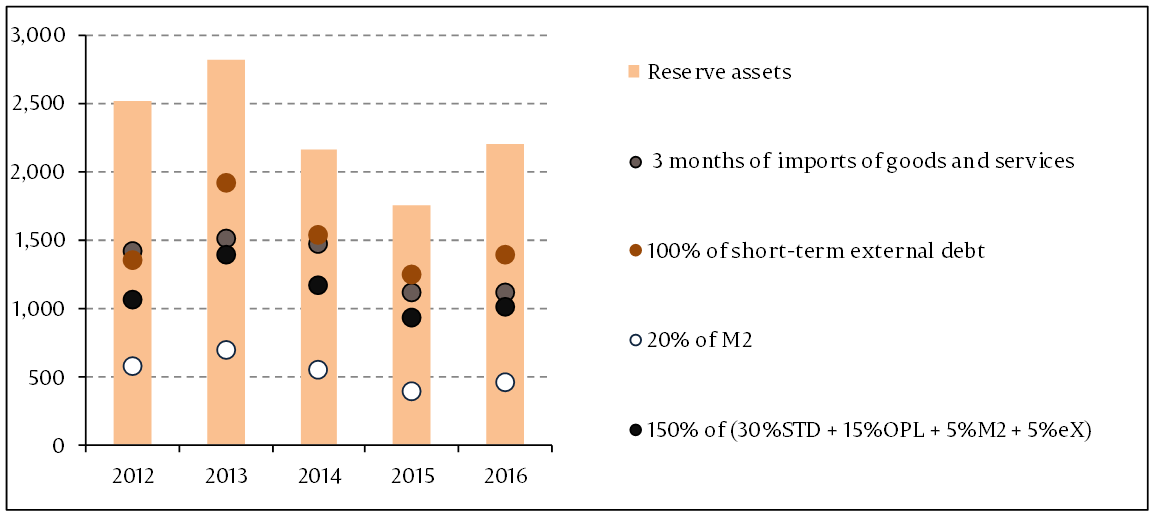
Note: STD – short-term debt, OPL – other portfolio liabilities, M2 – broad money, export-export of goods and services. Criteria based on the IMF recommendations specified in “Assessing Reserve Adequacy - Specific Proposals", April 2015:
Table 5. Main indicators of the external debt (BPM6)
|
|
31.12.
2012
|
31.12.
2013
|
31.12.
2014
|
31.12.
2015
|
31.12.
2016
|
31.12.2016 / 31.12.2015 (%)
|
|
Gross external debt, US$ mill.
|
6,004.82
|
6,874.27
|
6,495.79
|
6,104.21
|
6,235.23
|
102.1
|
|
Public and publicly guaranteed external debt, US$ mill.
|
1,762.57
|
1,774.92
|
1,731.05
|
1,702.11
|
1,779.36
|
104.5
|
|
Long-term external debt, US$ mill.
|
4,646.93
|
4,962.77
|
4,953.99
|
4,854.62
|
4,846.64
|
99.8
|
|
Share of public and publicly guaranteed external debt in gross external debt, %
|
29.4
|
25.8
|
26.6
|
27.9
|
28.5
|
0.7 p.p.
|
|
Share of long-term external debt in gross external debt, %
|
77.4
|
72.2
|
76.3
|
79.5
|
77.7
|
-1.8 p.p.
|
|
Share of international organizations and foreign governments (creditors) in the external debt in the form of loans and SDR allocations, %
|
48.3
|
45.8
|
44.9
|
44.2
|
44.7
|
0.5 p.p.
|
|
Official reserve assets / Short-term external debt, %
|
185.2
|
147.6
|
139.9
|
140.6
|
158.9
|
18.3 p.p.
|
Note: p. p. – percentage points
Details on international accounts evolution (balance of payments, international investment position and external debt) can be found in the analytical materials published on the official website of NBM:
Time series are available starting from:
-
1995 for the balance of payments according to BPM5, 2009 for the balance of payments according to BPM6;
-
1998 for the BPM5 international investment position, 2008 for the BPM6 international investment position;
-
2001 for the BPM5 external debt, 2009 for the BPM6 external debt.
Balance of payments (BPM6)
International investment position (BPM6)
External debt (BPM6)
Interactive database:
Balance of payments
International investment position
External debt