International accounts of the Republic of Moldova for Q I 2016 (preliminary data) – all analytical comments
In Q I 2016, the current account of the balance of payments recorded a deficit of US$ 104.67 million (down by 26.5 percent as compared to January-March 2015), the capital account registered a negative balance of US$ 11.12 million and the financial account recorded a net inflow of US$ 69.88 million. The international investment position of the Republic of Moldova remained net debit totaling US$ -5,831.37 million, while the gross external debt of the Republic of Moldova reached US$ 6,399.63 million.
Table 1. Main macroeconomic indicators of the Republic of Moldova
|
|
UM
|
2014
|
2015
|
2016
|
|
Q I
|
Q II
|
Q III
|
Q IV
|
Q I
|
Q II
|
Q III
|
Q IV
|
Q I
|
|
Gross domestic product in current prices
|
MDL million
|
21,533
|
26,343
|
34,215
|
29,958
|
24,423
|
28,527
|
35,890
|
33,011
|
27,097
|
|
Gross domestic product in current prices
|
US$ million
|
1,608
|
1,926
|
2,435
|
1,995
|
1,357
|
1,573
|
1,869
|
1,658
|
1,350
|
|
GDP, physical volume indices
|
%
|
103.8
|
104.4
|
106.0
|
104.4
|
104.8
|
102.5
|
96.3
|
96.7
|
100.8
|
|
Exports of goods, physical volume indices
|
%
|
106.0
|
113.0
|
98.0
|
100.0
|
106.0
|
107.0
|
96.0
|
97.0
|
90.0
|
|
Imports of goods, physical volume indices
|
%
|
100.0
|
98.0
|
99.0
|
104.0
|
101.0
|
96.0
|
95.0
|
91.0
|
104.0
|
|
Terms of trade (export unit value index / import unit value index)
|
%
|
93.9
|
97.0
|
97.9
|
96.7
|
101.3
|
100.0
|
107.7
|
114.1
|
108.0
|
|
Period average exchange rate
|
MDL/USD
|
13.3875
|
13.6771
|
14.0539
|
15.0185
|
17.9989
|
18.1309
|
19.1982
|
19.9112
|
20.0737
|
|
Personal remittances / GDP
|
%
|
24.6
|
27.1
|
23.1
|
22.1
|
23.1
|
24.1
|
19.5
|
21.2
|
21.4
|
|
FDI flows (net incurrence of liabilities) / GDP
|
%
|
8.8
|
0.4
|
4.0
|
5.3
|
10.7
|
5.0
|
-0.8
|
3.8
|
3.3
|
Sources: NBM, NBS
Table 2. Contribution of the main components to the evolution of the BOP current account
|
|
2014
|
2015
|
2016
|
% change
|
|
Q I
|
Q II
|
Q III
|
Q IV
|
Q I
|
Q II
|
Q III
|
Q IV
|
Q I
|
Q I 2016 /
Q I 2015
|
|
|
%
|
p.p.
|
|
Current account / GDP
|
-9.4
|
-5.8
|
-4.3
|
-9.9
|
-10.5
|
-8.1
|
-6.3
|
-4.6
|
-7.8
|
2.7
|
|
Trade balance / GDP
|
-38.4
|
-38.1
|
-31.6
|
-40.7
|
-34.8
|
-31.1
|
-27.8
|
-27.9
|
-30.9
|
3.8
|
|
Exports of goods and services / GDP
|
43.9
|
38.0
|
29.4
|
39.1
|
44.0
|
40.2
|
31.4
|
40.2
|
39.1
|
-4.9
|
|
Imports of goods and services / GDP
|
82.3
|
76.1
|
61.0
|
79.7
|
78.8
|
71.3
|
59.1
|
68.1
|
70.1
|
-8.7
|
|
Primary income balance / GDP
|
9.7
|
11.4
|
9.4
|
11.1
|
6.8
|
4.4
|
7.2
|
6.4
|
6.0
|
-0.9
|
|
Primary income inflow / GDP, of which:
|
14.0
|
15.9
|
13.2
|
13.2
|
13.4
|
14.0
|
11.3
|
12.0
|
11.4
|
-2.0
|
|
Compensation of employees / GDP
|
13.3
|
15.4
|
12.7
|
12.5
|
12.7
|
13.5
|
10.9
|
11.6
|
11.0
|
-1.7
|
|
Primary income outflow / GDP, of which:
|
4.3
|
4.5
|
3.8
|
2.1
|
6.6
|
9.6
|
4.1
|
5.6
|
5.5
|
-1.1
|
|
Investment income / GDP
|
3.3
|
3.6
|
3.0
|
1.1
|
5.2
|
8.2
|
3.0
|
4.2
|
4.1
|
-1.1
|
|
Secondary income balance / GDP
|
19.3
|
20.9
|
17.9
|
19.6
|
17.4
|
18.7
|
14.3
|
16.9
|
17.2
|
-0.2
|
|
Secondary income inflow / GDP, of which:
|
21.3
|
22.8
|
19.5
|
21.6
|
19.8
|
21.0
|
16.3
|
19.0
|
19.4
|
-0.4
|
|
Personal transfers / GDP
|
13.4
|
14.1
|
12.3
|
11.5
|
12.4
|
12.8
|
10.3
|
11.5
|
12.3
|
-0.1
|
|
Current international cooperation / GDP
|
3.4
|
4.1
|
3.8
|
6.0
|
3.5
|
3.0
|
2.4
|
3.1
|
3.0
|
-0.5
|
|
Secondary income outflow / GDP
|
2.0
|
1.9
|
1.6
|
1.9
|
2.3
|
2.3
|
2.0
|
2.1
|
2.2
|
-0.1
|
|
Capital account / GDP
|
0.1
|
2.5
|
0.5
|
1.6
|
-0.3
|
0.6
|
0.5
|
0.5
|
-0.8
|
-0.5
|
|
Net borrowing (current and capital account balance) / GDP
|
-9.3
|
-3.3
|
-3.8
|
-8.3
|
-10.8
|
-7.5
|
-5.8
|
-4.1
|
-8.6
|
2.3
|
Table 3. Sources of coverage for the net borrowing, net financial flows
|
|
2014
|
2015
|
2016
|
% change
|
|
Q I
|
Q II
|
Q III
|
Q IV
|
Q I
|
Q II
|
Q III
|
Q IV
|
Q I
|
Q I 2016 /
Q IV 2015
|
|
% to GDP
|
p.p.
|
|
Financial account
|
-12.1
|
-0.2
|
-3.3
|
-14.3
|
-14.6
|
-7.9
|
-4.3
|
-4.2
|
-5.2
|
-1.0
|
|
Direct investment, of which:
|
-8.8
|
0.0
|
-3.4
|
-4.5
|
-10.5
|
-4.9
|
0.8
|
-3.6
|
-3.6
|
|
|
Equity other than reinvestment of
earnings
|
-2.1
|
-3.4
|
-0.5
|
-0.7
|
-0.9
|
-1.0
|
-0.8
|
-1.0
|
-0.3
|
0.7
|
|
Reinvestment of earnings
|
-0.9
|
-0.4
|
-1.6
|
1.4
|
-3.1
|
-5.2
|
-0.8
|
-1.2
|
-1.8
|
-0.6
|
|
Debt instruments
|
-5.8
|
3.8
|
-1.2
|
-5.2
|
-6.4
|
1.3
|
2.4
|
-1.4
|
-1.5
|
-0.1
|
|
Portfolio investment and financial derivatives
|
-0.3
|
-0.2
|
0.0
|
-0.2
|
-0.1
|
-0.2
|
|
|
|
|
|
Other investment, of which:
|
3.1
|
-0.8
|
0.6
|
12.7
|
19.0
|
-3.3
|
-4.2
|
-1.4
|
-0.4
|
1.0
|
|
Currency and deposits
|
1.8
|
2.5
|
1.3
|
3.8
|
19.0
|
-2.1
|
-0.2
|
-0.8
|
-1.7
|
-0.9
|
|
Loans
|
0.1
|
0.1
|
2.2
|
-2.6
|
1.7
|
0.9
|
-1.6
|
-1.2
|
1.9
|
3.1
|
|
Trade credit and advances
|
1.0
|
-3.4
|
-3.0
|
-0.7
|
-1.8
|
-2.2
|
-2.5
|
0.5
|
-0.7
|
-1.2
|
|
Other accounts payable / receivable
|
0.1
|
0.1
|
0.0
|
12.2
|
0.1
|
|
0.1
|
0.1
|
0.1
|
|
|
Change in reserve assets
|
-6.0
|
0.8
|
-0.4
|
-22.4
|
-23.0
|
0.6
|
-0.9
|
0.8
|
-1.2
|
-2.0
|
Note: (-) – net capital inflow, (+) – net capital outflow
Table 4. Main indicators of the international investment position
|
|
UM
|
31.12.12
|
31.12.13
|
31.12.14
|
31.12.15
|
31.03.16
|
Q I 2016 /
Q IV 2015 (%)
|
|
Net international investment position
|
US$ million
|
-5,085.32
|
-5,346.05
|
-5,598.09
|
-5,713.43
|
-5,831.37
|
102.1
|
|
Stock of foreign assets / stock of foreign liabilities
|
%
|
41.1
|
43.0
|
39.9
|
36.9
|
36.2
|
-0.7 p.p.
|
|
Stock of foreign direct investment, liabilities
|
US$ million
|
3,466.67
|
3,620.97
|
3,613.78
|
3,538.59
|
3,580.25
|
101.2
|
|
Share of foreign investment in the stock of foreign liabilities
|
%
|
40.1
|
38.6
|
38.8
|
39.1
|
39.2
|
0.1 p.p.
|
|
Share of loans (without intercompany loans) in the stock of foreign liabilities
|
%
|
35.0
|
34.5
|
32.9
|
32.6
|
32.3
|
-0.3 p.p.
|
|
Stock of reserve assets
|
US$ million
|
2,515.00
|
2,820.63
|
2,156.63
|
1,756.81
|
1,746.33
|
99.4
|
|
Stock of reserve assets / Average monthly imports of goods and services (for 12 months)
|
months
|
5.3
|
5.6
|
4.4
|
4.8
|
4.9
|
102.2
|
Chart 1. Indices of reserve assets adequacy, end of period, US$ million
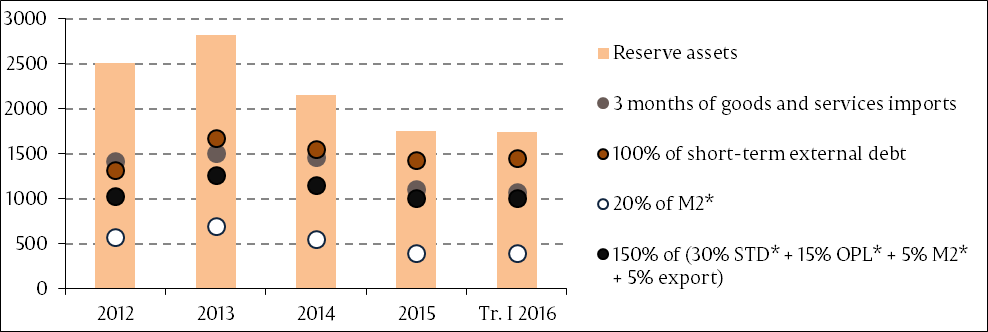
Note: Criteria based on the IMF recommendations specified in „Assessing Reserve Adequacy - Specific Proposals”, April 2015: http://www.imf.org/external/np/pp/eng/2014/121914.pdf
*M2 – broad money; STD – short-term debt; OPL – other portfolio liabilities
Table 5. Main indicators of the external debt (BPM6)
|
|
UM
|
31.12.12
|
31.12.13
|
31.12.14
|
31.12.2015
|
31.03.16
|
Q I 2016 / Q IV 2015 (%)
|
|
Gross external debt
|
US$ million
|
6,019.84
|
6,674.38
|
6,570.26
|
6,338.39
|
6,399.63
|
101.0
|
|
Publicly and publicly guaranteed external debt
|
US$ million
|
1,762.57
|
1,774.93
|
1,731.05
|
1,702.04
|
1,708.97
|
100.4
|
|
Long-term external debt
|
US$ million
|
4,698.20
|
5,003.79
|
5,012.32
|
4,904.00
|
4,944.24
|
100.8
|
|
Share of public and publicly guaranteed external debt in gross external debt
|
%
|
29.3
|
26.6
|
26.3
|
26.9
|
26.7
|
-0.2 p.p.
|
|
Share of long-term external debt in gross external debt
|
%
|
78.0
|
75.0
|
76.3
|
77.4
|
77.3
|
-0.1 p.p.
|
|
Share of international organizations and foreign governments (creditors) in the external debt in the form of loans and SDR allocations
|
%
|
48.0
|
44.9
|
43.7
|
43.1
|
43.1
|
|
Balance of payments for Q I 2016 (preliminary data)
International investment position at the end of Q I 2016 (preliminary data)
External debt at the end of Q I 2016 (preliminary data)
Time series on balance of payments according to BPM5 are available starting from 1995, according to BPM6 – from 2009, international investment position (BPM5) – from 1998, and external debt (BPM5 and BPM6) – from 2001:
Balance of payments (BPM6)
Balance of payments
International investment position
External debt