International accounts for Q II 2017 (preliminary data) – all analytical comments
In January-June 2017, the current account of the balance of payments recorded a deficit of US$ 307.22 million (of which US$ 187.17 in quarter II 2017), which worsened by 77.8 percent as compared to January-June 2016. The capital account registered a deficit of US$ 13.16 million (of which US$ 6.47 million in quarter II 2017) and the financial account recorded a net capital inflow of US$ 162.76 million (of which US$ 111.48 million in quarter II 2017). The international investment position of the Republic of Moldova remained net debit, totaling US$ -3,958.60 million at the end of the quarter II 2017, while the gross external debt of the Republic of Moldova reached US$ 6,549.23 million.
Table 1. Main macroeconomic indicators of the Republic of Moldova
|
|
2015
|
2016
|
2017
|
|
I
|
II
|
I
|
II
|
III
|
IV
|
I
|
II
|
|
Gross domestic product in current prices, MDl mil.
|
24,462
|
28,595
|
27,156
|
31,533
|
39,901
|
36,347
|
29,670
|
34,251
|
|
Gross domestic product in current prices, US$ mill.
|
1,359
|
1,577
|
1,353
|
1,593
|
2,016
|
1,814
|
1,487
|
1,826
|
|
GDP, physical volume indices, %
|
104.8
|
102.5
|
100.8
|
101.9
|
106.5
|
106.7
|
103.1
|
102.5
|
|
Exports of goods, physical volume indices, %
|
106
|
107
|
90
|
99
|
121
|
123
|
128
|
105
|
|
Exports of goods, unit value indices, %
|
80
|
79
|
95
|
98
|
96
|
96
|
99
|
97
|
|
Imports of goods, physical volume indices, %
|
101
|
96
|
104
|
107
|
112
|
111
|
120
|
113
|
|
Imports of goods, unit value indices, %
|
79
|
79
|
88
|
93
|
94
|
99
|
100
|
101
|
|
Terms of trade, %
|
101.3
|
100.0
|
108.0
|
105.4
|
101.8
|
96.8
|
99.7
|
96.6
|
|
Period average exchange rate, MDL/USD
|
17.9989
|
18.1309
|
20.0737
|
19.7957
|
19.7896
|
20.0364
|
19.9556
|
18.7525
|
|
Personal remittances / GDP, %
|
24.1
|
24.4
|
21.8
|
22.6
|
18.1
|
19.7
|
22.5
|
21.3
|
|
FDI flows (net incurrence of liabilities) / GDP, %
|
10.0
|
4.7
|
3.1
|
-0.3
|
3.4
|
1.1
|
2.5
|
2.1
|
Sourses: NBM, NBS
Table 2. Contribution of the main components to the evolution of the BOP current account(BPM6)
|
|
2015
|
2016
|
2017
|
2016
I-II
|
2017
I-II
|
I-II 2017 /
I-II 2016
|
|
I
|
II
|
I
|
II
|
I
|
II
|
Contribution
|
|
% to GDP
|
p. p.
|
|
Current account
|
-11.1
|
-9.2
|
-6.8
|
-5.1
|
-8.1
|
-10.2
|
-5.9
|
-9.3
|
-3.4
|
|
Trade balance
|
-35.6
|
-32.0
|
-31.0
|
-30.5
|
-31.3
|
-33.7
|
-30.8
|
-32.7
|
-1.9
|
|
Exports of goods and services
|
43.9
|
40.0
|
38.9
|
38.8
|
44.8
|
36.2
|
39.0
|
40.1
|
1.1
|
|
Imports of goods and services
|
79.5
|
72.0
|
69.9
|
69.3
|
76.1
|
69.9
|
69.8
|
72.9
|
3.0
|
|
Primary income balance
|
7.0
|
4.2
|
6.3
|
8.1
|
7.0
|
7.7
|
7.3
|
7.4
|
0.1
|
|
Primary income inflow, of which:
|
13.6
|
13.9
|
11.4
|
12.2
|
12.3
|
11.9
|
11.9
|
12.1
|
0.2
|
|
Compensation of employees
|
12.9
|
13.4
|
11.0
|
11.7
|
11.8
|
11.3
|
11.4
|
11.6
|
0.2
|
|
Primary income outflow, of which:
|
6.6
|
9.7
|
5.1
|
4.0
|
5.3
|
4.2
|
4.6
|
4.7
|
0.2
|
|
Investment income
|
5.2
|
8.3
|
3.9
|
3.0
|
4.1
|
3.1
|
3.4
|
3.6
|
0.2
|
|
Secondary income balance
|
17.4
|
18.7
|
17.9
|
17.3
|
16.2
|
15.8
|
17.6
|
16.0
|
-1.6
|
|
Secondary income inflow, of which:
|
19.8
|
21.0
|
19.9
|
19.2
|
18.2
|
17.6
|
19.6
|
17.9
|
-1.6
|
|
Personal transfers
|
12.6
|
12.7
|
12.3
|
12.2
|
11.8
|
11.1
|
12.3
|
11.5
|
-0.8
|
|
Current international cooperation
|
3.5
|
3.1
|
3.0
|
2.7
|
2.0
|
2.3
|
2.8
|
2.2
|
-0.7
|
|
Secondary income outflow
|
2.3
|
2.4
|
2.0
|
1.9
|
2.0
|
1.8
|
2.0
|
1.9
|
0.0
|
|
Capital account
|
0.3
|
1.0
|
-0.5
|
-0.2
|
-0.4
|
-0.4
|
-0.3
|
-0.4
|
-0.1
|
|
Net borrowing (current and capital account balance)
|
-10.9
|
-8.2
|
-7.3
|
-5.3
|
-8.5
|
-10.6
|
-6.2
|
-9.7
|
-3.5
|
*percentage points
Table 3. Sources of coverage for the net borrowing, net financial flows, % to GDP
|
|
2016
|
2017
|
2016
III-IV
|
2017
I-II
|
I-II 2017 /
III-IV 2016
|
|
I
|
II
|
III
|
IV
|
I
|
II
|
Contribution
|
|
% to GDP
|
p. p.
|
|
Financial account
|
-11.3
|
-2.0
|
-3.0
|
1.7
|
-3.4
|
-6.1
|
-0.8
|
-4.9
|
-4.1
|
|
Direct investment, of which:
|
-2.5
|
0.6
|
-3.3
|
-1.0
|
-2.4
|
-1.9
|
-2.2
|
-2.2
|
0.1
|
|
Equity other than reinvestment of earnings
|
-0.4
|
-0.2
|
-0.6
|
-0.8
|
-0.2
|
0.0
|
-0.7
|
-0.1
|
0.6
|
|
Reinvestment of earnings
|
-1.8
|
-1.0
|
-2.9
|
0.4
|
-2.2
|
-0.9
|
-1.3
|
-1.5
|
-0.2
|
|
Debt instruments
|
-0.3
|
1.8
|
0.1
|
-0.6
|
0.0
|
-1.0
|
-0.2
|
-0.6
|
-0.4
|
|
Portfolio investment and financial derivatives
|
0.0
|
0.0
|
0.0
|
0.1
|
-0.1
|
0.0
|
0.0
|
0.0
|
0.0
|
|
Other investment, of which:
|
-7.6
|
-12.8
|
-13.7
|
-3.0
|
-3.5
|
-9.8
|
-8.6
|
-7.0
|
1.6
|
|
Currency and deposits
|
-6.6
|
-8.5
|
-8.4
|
2.9
|
-1.5
|
-5.1
|
-3.0
|
-3.5
|
-0.5
|
|
Loans
|
1.9
|
-0.1
|
-2.7
|
-3.3
|
-0.6
|
-2.0
|
-3.0
|
-1.4
|
1.6
|
|
Trade credit and advances
|
-2.9
|
-3.1
|
-1.7
|
-2.7
|
-1.5
|
-2.8
|
-2.2
|
-2.2
|
0.0
|
|
Other accounts receivable / payable
|
0.1
|
-1.1
|
-0.9
|
0.1
|
0.1
|
0.1
|
-0.5
|
0.1
|
0.5
|
|
Change in reserve assets
|
-1.1
|
10.2
|
14.0
|
5.7
|
2.5
|
5.7
|
10.0
|
4.3
|
-5.8
|
Note: (-) – net capital inflow, (+) – net capital outflow
*percentage points
Table 4. Main indicators of the international investment position (BPM5)
|
|
31.12.2014
|
31.12.2015
|
31.12.2016
|
31.03.2017
|
30.06.2017
|
30.06.2017 / 31.12.2016 (%)
|
|
Net IIP, US$ mill.
|
-3,324.12
|
-3,478.99
|
-3,548.33
|
-3,643.45
|
-3,958.60
|
111.6
|
|
Stock of foreign assets / stock of foreign liabilities, %
|
59.7
|
53.2
|
53.6
|
53.4
|
52.2
|
-1.4 p.p.
|
|
Stock of direct investment, liabilities, US$ mill.
|
3,391.74
|
3,001.23
|
3,079.32
|
3,167.55
|
3,444.67
|
111.9
|
|
Share of FDI in the stock of foreign liabilities, %
|
41.1
|
40.3
|
40.3
|
40.5
|
41.6
|
1.3 p.p.
|
|
Share of loans (without intercompany loans) in the stock of foreign liabilities, %
|
37.9
|
40.9
|
40.5
|
40.2
|
39.3
|
-1.2 p.p.
|
|
Stock of official reserve assets, US$ mill.
|
2,156.63
|
1,756.81
|
2,205.93
|
2,256.45
|
2,388.74
|
108.3
|
|
Stock of reserve assets / Average monthly imports of goods and services (for 12 months), months
|
4.4
|
4.7
|
5.9
|
5.8
|
5.9
|
100.3
|
*percentage points
Chart 1. Indices of reserve assets adequacy, at period-end, US$ million
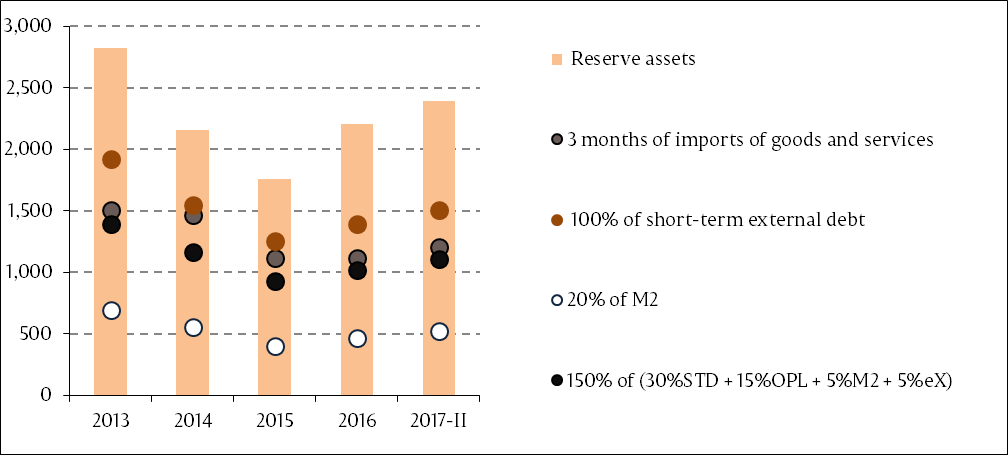
Note: STD – short-term debt, OPL – other portfolio liabilities, M2 – broad money, export-export of goods and services. Criteria based on the IMF recommendations specified in “Assessing Reserve Adequacy - Specific Proposals", April 2015:
Table 5. Main indicators of the external debt (BPM6)
|
|
31.12.2014
|
31.12.2015
|
31.12.2016
|
31.03.2017
|
30.06.2017
|
30.06.2017 / 31.12.2016 (%)
|
|
Gross external debt, US$ mill.
|
6,495.80
|
6,104.22
|
6,235.24
|
6,327.21
|
6,549.23
|
105.0
|
|
Public and publicly guaranteed external debt, US$ mill.
|
1,731.05
|
1,702.11
|
1,779.36
|
1,826.79
|
1,909.35
|
107.3
|
|
Long-term external debt, US$ mill.
|
4,947.51
|
4,848.15
|
4,839.84
|
4,893.51
|
5,039.25
|
104.1
|
|
Share of public and publicly guaranteed external debt in gross external debt, %
|
26.6
|
27.9
|
28.5
|
28.9
|
29.2
|
0.6 p.p.
|
|
Share of long-term external debt in gross external debt, %
|
76.2
|
79.4
|
77.6
|
77.3
|
76.9
|
-0.7 p.p.
|
|
Share of international organizations and foreign governments (creditors) in the external debt in the form of loans and SDR allocations, %
|
44.9
|
44.2
|
44.4
|
44.8
|
45.3
|
0.9 p.p.
|
|
Official reserve assets / Short-term external debt, %
|
139.3
|
139.9
|
158.1
|
157.4
|
158.2
|
0.1 p.p.
|
Note: p. p. – percentage points
Details on international accounts evolution (balance of payments, international investment position and external debt) can be found in the analytical materials published on the official website of NBM:
Time series are available starting from:
-
1995 for the balance of payments (BPM5), 2009 for the balance of payments (BPM6);
-
1998 for the international investment position (BPM5), 2012 for the international investment position (BPM6);
-
2001 for the external debt (BPM5), 2009 for the external debt (BPM6).
Balance of payments (BPM6)
International investment position (BPM6)
External debt (BPM6)
Interactive database:
Balance of payments
International investment position
External debt