Bine ați venit pe pagină oficială a Băncii Naționale a Moldovei!
×
Ai vederea bună și dorești să închizi acest instrument?


Bine ați venit pe pagină oficială a Băncii Naționale a Moldovei!
Cele mai populare rapoarte statistice:

Banca Naţională şi membrii organelor de conducere ale acesteia sunt independenţi în exercitarea atribuţiilor stabilite de lege şi nu pot solicita şi nici accepta instrucţiuni de la autorităţile publice sau de la orice altă autoritate.

Banca Naţională informează publicul despre evoluția inflației anuale, strategia de politică monetară,rezultatele analizei macroeconomice, evoluţiei pieţei financiare şi informaţia statistică, inclusiv privind masa monetară, acordarea creditelor, balanţa de plăţi şi situaţia pieţei valutare.
Pentru asigurarea şi menţinerea stabilităţii preţurilor pe termen mediu, Banca Naţională a Moldovei menţine inflaţia (măsurată prin indicele preţurilor de consum) la nivelul de 5.0 la sută anual cu o posibilă abatere de ± 1.5 puncte procentuale, fiind considerat nivelul optim pentru creşterea şi dezvoltarea economică a Republicii Moldova pe termen mediu.

Stabilitatea financiară se realizează prin consolidarea rezilienței sistemului financiar, limitarea efectului de contagiune și diminuarea acumulării de riscuri sistemice, contribuind, astfel, la sustenabilitatea sectorului financiar și creșterea economică.
Banca Naţională a Moldovei, are dreptul exclusiv de a emite pe teritoriul Republicii Moldova bancnote şi monede metalice ca mijloc de plată. BNM pune în circulaţie bancnote şi monede metalice, prin intermediul sistemului bancar.

Banca Naţională este unica instituţie care efectuează licenţierea, supravegherea şi reglementarea activităţii instituţiilor financiare.

Banca Națională supraveghează sistemul de plăţi în Republica Moldova şi promovează funcţionarea stabilă şi eficientă a sistemului automatizat de plăţi interbancare.

Banca Naţională este o persoană juridică publică autonomă şi este responsabilă faţă de Parlament.
BNM publică statistici privind masa monetară, sectorul bancar, balanța de plăți, situația pieței valutare, etc. pentru a asigura transparența în procesul de elaborare și adoptare a deciziilor BNM, a asigura continuitatea în comunicare și predictibilitatea BNM pe piață, pentru sporirea credibilității BNM în calitate de bancă centrală dar și pe piața financiar-bancară din Republica Moldova.
Table 1. Main macroeconomic indicators of the Republic of Moldova
|
|
UM |
Q I 2013 |
Q II 2013 |
Q III 2013 |
Q IV 2013 |
Q I 2014 |
|
Gross domestic product in current prices |
MDL million |
19,673 |
23,703 |
29,936 |
26,567 |
21,469 |
|
Period average exchange rate |
MDL / USD |
12.1855 |
12.3834 |
12.7675 |
13.0153 |
13.3875 |
|
Current account / GDP |
% |
-7.1 |
-10.8 |
-2.0 |
-0.7 |
-5.9 |
|
Compensation of employees and personal transfers / GDP |
% |
24.7 |
25.5 |
23.3 |
26.5 |
24.2 |
|
Balance of goods and services / GDP |
% |
-39.1 |
-41.7 |
-31.7 |
-39.6 |
-38.6 |
|
Exports of goods and services / Imports of goods and services |
% |
56.5 |
50.2 |
54.6 |
54.8 |
56.5 |
|
Average export propensity index (goods and services / GDP) |
% |
50.9 |
42.1 |
38.1 |
48.0 |
50.2 |
|
Average import propensity index (goods and services / GDP) |
% |
90.0 |
83.8 |
69.7 |
87.5 |
88.7 |
|
Foreign direct investment in domestic economy, net flow / GDP |
% |
3.3 |
3.7 |
2.0 |
3.0 |
1.1 |
Chart 1. Balance of payments components, quarterly dynamics (US$ million)
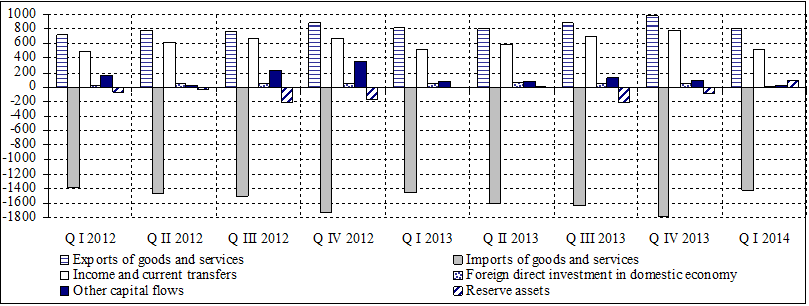
Table 2. Main macroeconomic indicators of international investment position and external debt
|
|
UM |
End of 2010 |
End of 2011 |
End of 2012 |
End of 2013 |
End of Q I 2014 |
|
Net international investment position |
US$ million |
-4,187.59 |
-4,805.99 |
-5,030.45 |
-5,345.01 |
-5,482.43 |
|
Stock of foreign assets / Stock of foreign liabilities |
% |
39.6 |
38.6 |
41.5 |
43.1 |
42.7 |
|
Foreign direct investment in domestic economy, stock |
US$ million |
2,964.45 |
3,261.06 |
3,446.93 |
3,668.27 |
3,677.57 |
|
Stock of reserve assets / Imports of goods and services month average (per year) |
month |
4.5 |
3.9 |
4.9 |
5.2 |
5.1 |
|
Stock of reserve assets / short-term external debt |
% |
113.1 |
107.5 |
129.9 |
121.5 |
109.8 |
|
External debt |
US$ million |
4,711.10 |
5,358.91 |
5,983.76 |
6,612.68 |
6,754.03 |
|
Publicly and publicly guaranteed external debt |
US$ million |
1,348.68 |
1,521.35 |
1,762.56 |
1,774.92 |
1,775.35 |
|
Non-guaranteed private debt |
US$ million |
3,362.42 |
3,837.56 |
4,221.19 |
4,837.77 |
4,978.68 |
|
Share of long-term external debt in gross external debt |
% |
67.8 |
65.9 |
67.6 |
64.9 |
63.2 |
|
Short term external debt |
US$ million |
1,518.20 |
1,827.90 |
1,936.80 |
2,321.27 |
2,483.80 |
Details on international accounts evolution (balance of payments, international investment position and external debt) can be found in analytical materials published on the official website of NBM
Balance of payments for quarter I, 2014 (preliminary data)
International investment position at the end of quarter I, 2014 (preliminary data)
External debt at the end of quarter I, 2014
Statistical series on balance of payments (from 1995), international investment position (from 1998) and external debt (from 2000) can be found on the official website of NBM:


