Bine ați venit pe pagină oficială a Băncii Naționale a Moldovei!
×
Ai vederea bună și dorești să închizi acest instrument?


Bine ați venit pe pagină oficială a Băncii Naționale a Moldovei!
Cele mai populare rapoarte statistice:

Banca Naţională şi membrii organelor de conducere ale acesteia sunt independenţi în exercitarea atribuţiilor stabilite de lege şi nu pot solicita şi nici accepta instrucţiuni de la autorităţile publice sau de la orice altă autoritate.

Banca Naţională informează publicul despre evoluția inflației anuale, strategia de politică monetară,rezultatele analizei macroeconomice, evoluţiei pieţei financiare şi informaţia statistică, inclusiv privind masa monetară, acordarea creditelor, balanţa de plăţi şi situaţia pieţei valutare.
Pentru asigurarea şi menţinerea stabilităţii preţurilor pe termen mediu, Banca Naţională a Moldovei menţine inflaţia (măsurată prin indicele preţurilor de consum) la nivelul de 5.0 la sută anual cu o posibilă abatere de ± 1.5 puncte procentuale, fiind considerat nivelul optim pentru creşterea şi dezvoltarea economică a Republicii Moldova pe termen mediu.

Stabilitatea financiară se realizează prin consolidarea rezilienței sistemului financiar, limitarea efectului de contagiune și diminuarea acumulării de riscuri sistemice, contribuind, astfel, la sustenabilitatea sectorului financiar și creșterea economică.
Banca Naţională a Moldovei, are dreptul exclusiv de a emite pe teritoriul Republicii Moldova bancnote şi monede metalice ca mijloc de plată. BNM pune în circulaţie bancnote şi monede metalice, prin intermediul sistemului bancar.

Banca Naţională este unica instituţie care efectuează licenţierea, supravegherea şi reglementarea activităţii instituţiilor financiare.

Banca Națională supraveghează sistemul de plăţi în Republica Moldova şi promovează funcţionarea stabilă şi eficientă a sistemului automatizat de plăţi interbancare.

Banca Naţională este o persoană juridică publică autonomă şi este responsabilă faţă de Parlament.

BNM publică statistici privind masa monetară, sectorul bancar, balanța de plăți, situația pieței valutare, etc. pentru a asigura transparența în procesul de elaborare și adoptare a deciziilor BNM, a asigura continuitatea în comunicare și predictibilitatea BNM pe piață, pentru sporirea credibilității BNM în calitate de bancă centrală dar și pe piața financiar-bancară din Republica Moldova.
In Q I 2016, the current account of the balance of payments recorded a deficit of US$ 104.67 million (down by 26.5 percent as compared to January-March 2015), the capital account registered a negative balance of US$ 11.12 million and the financial account recorded a net inflow of US$ 69.88 million. The international investment position of the Republic of Moldova remained net debit totaling US$ -5,831.37 million, while the gross external debt of the Republic of Moldova reached US$ 6,399.63 million.
Table 1. Main macroeconomic indicators of the Republic of Moldova
|
|
UM |
2014 |
2015 |
2016 |
||||||
|
Q I |
Q II |
Q III |
Q IV |
Q I |
Q II |
Q III |
Q IV |
Q I |
||
|
Gross domestic product in current prices |
MDL million |
21,533 |
26,343 |
34,215 |
29,958 |
24,423 |
28,527 |
35,890 |
33,011 |
27,097 |
|
Gross domestic product in current prices |
US$ million |
1,608 |
1,926 |
2,435 |
1,995 |
1,357 |
1,573 |
1,869 |
1,658 |
1,350 |
|
GDP, physical volume indices |
% |
103.8 |
104.4 |
106.0 |
104.4 |
104.8 |
102.5 |
96.3 |
96.7 |
100.8 |
|
Exports of goods, physical volume indices |
% |
106.0 |
113.0 |
98.0 |
100.0 |
106.0 |
107.0 |
96.0 |
97.0 |
90.0 |
|
Imports of goods, physical volume indices |
% |
100.0 |
98.0 |
99.0 |
104.0 |
101.0 |
96.0 |
95.0 |
91.0 |
104.0 |
|
Terms of trade (export unit value index / import unit value index) |
% |
93.9 |
97.0 |
97.9 |
96.7 |
101.3 |
100.0 |
107.7 |
114.1 |
108.0 |
|
Period average exchange rate |
MDL/USD |
13.3875 |
13.6771 |
14.0539 |
15.0185 |
17.9989 |
18.1309 |
19.1982 |
19.9112 |
20.0737 |
|
Personal remittances / GDP |
% |
24.6 |
27.1 |
23.1 |
22.1 |
23.1 |
24.1 |
19.5 |
21.2 |
21.4 |
|
FDI flows (net incurrence of liabilities) / GDP |
% |
8.8 |
0.4 |
4.0 |
5.3 |
10.7 |
5.0 |
-0.8 |
3.8 |
3.3 |
Sources: NBM, NBS
Table 2. Contribution of the main components to the evolution of the BOP current account
|
|
2014 |
2015 |
2016 |
% change |
||||||
|
Q I |
Q II |
Q III |
Q IV |
Q I |
Q II |
Q III |
Q IV |
Q I |
Q I 2016 / Q I 2015 |
|
|
|
% |
p.p. |
||||||||
|
Current account / GDP |
-9.4 |
-5.8 |
-4.3 |
-9.9 |
-10.5 |
-8.1 |
-6.3 |
-4.6 |
-7.8 |
2.7 |
|
Trade balance / GDP |
-38.4 |
-38.1 |
-31.6 |
-40.7 |
-34.8 |
-31.1 |
-27.8 |
-27.9 |
-30.9 |
3.8 |
|
Exports of goods and services / GDP |
43.9 |
38.0 |
29.4 |
39.1 |
44.0 |
40.2 |
31.4 |
40.2 |
39.1 |
-4.9 |
|
Imports of goods and services / GDP |
82.3 |
76.1 |
61.0 |
79.7 |
78.8 |
71.3 |
59.1 |
68.1 |
70.1 |
-8.7 |
|
Primary income balance / GDP |
9.7 |
11.4 |
9.4 |
11.1 |
6.8 |
4.4 |
7.2 |
6.4 |
6.0 |
-0.9 |
|
Primary income inflow / GDP, of which: |
14.0 |
15.9 |
13.2 |
13.2 |
13.4 |
14.0 |
11.3 |
12.0 |
11.4 |
-2.0 |
|
Compensation of employees / GDP |
13.3 |
15.4 |
12.7 |
12.5 |
12.7 |
13.5 |
10.9 |
11.6 |
11.0 |
-1.7 |
|
Primary income outflow / GDP, of which: |
4.3 |
4.5 |
3.8 |
2.1 |
6.6 |
9.6 |
4.1 |
5.6 |
5.5 |
-1.1 |
|
Investment income / GDP |
3.3 |
3.6 |
3.0 |
1.1 |
5.2 |
8.2 |
3.0 |
4.2 |
4.1 |
-1.1 |
|
Secondary income balance / GDP |
19.3 |
20.9 |
17.9 |
19.6 |
17.4 |
18.7 |
14.3 |
16.9 |
17.2 |
-0.2 |
|
Secondary income inflow / GDP, of which: |
21.3 |
22.8 |
19.5 |
21.6 |
19.8 |
21.0 |
16.3 |
19.0 |
19.4 |
-0.4 |
|
Personal transfers / GDP |
13.4 |
14.1 |
12.3 |
11.5 |
12.4 |
12.8 |
10.3 |
11.5 |
12.3 |
-0.1 |
|
Current international cooperation / GDP |
3.4 |
4.1 |
3.8 |
6.0 |
3.5 |
3.0 |
2.4 |
3.1 |
3.0 |
-0.5 |
|
Secondary income outflow / GDP |
2.0 |
1.9 |
1.6 |
1.9 |
2.3 |
2.3 |
2.0 |
2.1 |
2.2 |
-0.1 |
|
Capital account / GDP |
0.1 |
2.5 |
0.5 |
1.6 |
-0.3 |
0.6 |
0.5 |
0.5 |
-0.8 |
-0.5 |
|
Net borrowing (current and capital account balance) / GDP |
-9.3 |
-3.3 |
-3.8 |
-8.3 |
-10.8 |
-7.5 |
-5.8 |
-4.1 |
-8.6 |
2.3 |
Table 3. Sources of coverage for the net borrowing, net financial flows
|
|
2014 |
2015 |
2016 |
% change |
||||||
|
Q I |
Q II |
Q III |
Q IV |
Q I |
Q II |
Q III |
Q IV |
Q I |
Q I 2016 / Q IV 2015 |
|
|
% to GDP |
p.p. |
|||||||||
|
Financial account |
-12.1 |
-0.2 |
-3.3 |
-14.3 |
-14.6 |
-7.9 |
-4.3 |
-4.2 |
-5.2 |
-1.0 |
|
Direct investment, of which: |
-8.8 |
0.0 |
-3.4 |
-4.5 |
-10.5 |
-4.9 |
0.8 |
-3.6 |
-3.6 |
|
|
Equity other than reinvestment of earnings |
-2.1 |
-3.4 |
-0.5 |
-0.7 |
-0.9 |
-1.0 |
-0.8 |
-1.0 |
-0.3 |
0.7 |
|
Reinvestment of earnings |
-0.9 |
-0.4 |
-1.6 |
1.4 |
-3.1 |
-5.2 |
-0.8 |
-1.2 |
-1.8 |
-0.6 |
|
Debt instruments |
-5.8 |
3.8 |
-1.2 |
-5.2 |
-6.4 |
1.3 |
2.4 |
-1.4 |
-1.5 |
-0.1 |
|
Portfolio investment and financial derivatives |
-0.3 |
-0.2 |
0.0 |
-0.2 |
-0.1 |
-0.2 |
|
|||
|
Other investment, of which: |
3.1 |
-0.8 |
0.6 |
12.7 |
19.0 |
-3.3 |
-4.2 |
-1.4 |
-0.4 |
1.0 |
|
Currency and deposits |
1.8 |
2.5 |
1.3 |
3.8 |
19.0 |
-2.1 |
-0.2 |
-0.8 |
-1.7 |
-0.9 |
|
Loans |
0.1 |
0.1 |
2.2 |
-2.6 |
1.7 |
0.9 |
-1.6 |
-1.2 |
1.9 |
3.1 |
|
Trade credit and advances |
1.0 |
-3.4 |
-3.0 |
-0.7 |
-1.8 |
-2.2 |
-2.5 |
0.5 |
-0.7 |
-1.2 |
|
Other accounts payable / receivable |
0.1 |
0.1 |
0.0 |
12.2 |
0.1 |
0.1 |
0.1 |
0.1 |
|
|
|
Change in reserve assets |
-6.0 |
0.8 |
-0.4 |
-22.4 |
-23.0 |
0.6 |
-0.9 |
0.8 |
-1.2 |
-2.0 |
Note: (-) – net capital inflow, (+) – net capital outflow
Table 4. Main indicators of the international investment position
|
|
UM |
31.12.12 |
31.12.13 |
31.12.14 |
31.12.15 |
31.03.16 |
Q I 2016 / Q IV 2015 (%) |
|
Net international investment position |
US$ million |
-5,085.32 |
-5,346.05 |
-5,598.09 |
-5,713.43 |
-5,831.37 |
102.1 |
|
Stock of foreign assets / stock of foreign liabilities |
% |
41.1 |
43.0 |
39.9 |
36.9 |
36.2 |
-0.7 p.p. |
|
Stock of foreign direct investment, liabilities |
US$ million |
3,466.67 |
3,620.97 |
3,613.78 |
3,538.59 |
3,580.25 |
101.2 |
|
Share of foreign investment in the stock of foreign liabilities |
% |
40.1 |
38.6 |
38.8 |
39.1 |
39.2 |
0.1 p.p. |
|
Share of loans (without intercompany loans) in the stock of foreign liabilities |
% |
35.0 |
34.5 |
32.9 |
32.6 |
32.3 |
-0.3 p.p. |
|
Stock of reserve assets |
US$ million |
2,515.00 |
2,820.63 |
2,156.63 |
1,756.81 |
1,746.33 |
99.4 |
|
Stock of reserve assets / Average monthly imports of goods and services (for 12 months) |
months |
5.3 |
5.6 |
4.4 |
4.8 |
4.9 |
102.2 |
Chart 1. Indices of reserve assets adequacy, end of period, US$ million
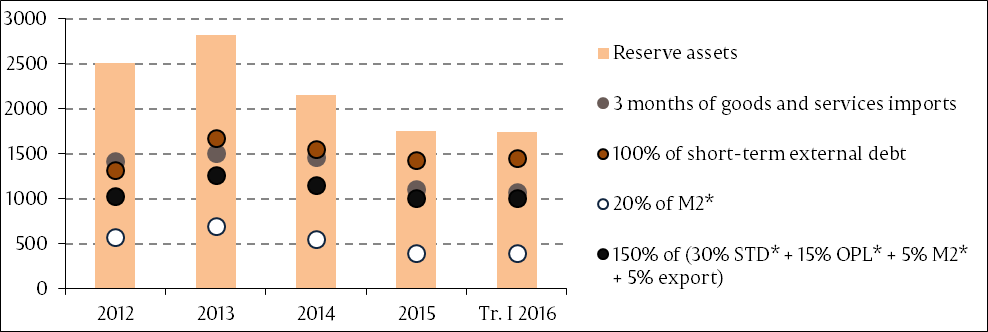
Note: Criteria based on the IMF recommendations specified in „Assessing Reserve Adequacy - Specific Proposals”, April 2015: http://www.imf.org/external/np/pp/eng/2014/121914.pdf
*M2 – broad money; STD – short-term debt; OPL – other portfolio liabilities
Table 5. Main indicators of the external debt (BPM6)
|
|
UM |
31.12.12 |
31.12.13 |
31.12.14 |
31.12.2015 |
31.03.16 |
Q I 2016 / Q IV 2015 (%) |
|
Gross external debt |
US$ million |
6,019.84 |
6,674.38 |
6,570.26 |
6,338.39 |
6,399.63 |
101.0 |
|
Publicly and publicly guaranteed external debt |
US$ million |
1,762.57 |
1,774.93 |
1,731.05 |
1,702.04 |
1,708.97 |
100.4 |
|
Long-term external debt |
US$ million |
4,698.20 |
5,003.79 |
5,012.32 |
4,904.00 |
4,944.24 |
100.8 |
|
Share of public and publicly guaranteed external debt in gross external debt |
% |
29.3 |
26.6 |
26.3 |
26.9 |
26.7 |
-0.2 p.p. |
|
Share of long-term external debt in gross external debt |
% |
78.0 |
75.0 |
76.3 |
77.4 |
77.3 |
-0.1 p.p. |
|
Share of international organizations and foreign governments (creditors) in the external debt in the form of loans and SDR allocations |
% |
48.0 |
44.9 |
43.7 |
43.1 |
43.1 |
|
Balance of payments for Q I 2016 (preliminary data)
International investment position at the end of Q I 2016 (preliminary data)
External debt at the end of Q I 2016 (preliminary data)
Time series on balance of payments according to BPM5 are available starting from 1995, according to BPM6 – from 2009, international investment position (BPM5) – from 1998, and external debt (BPM5 and BPM6) – from 2001:


