Welcome to the official website of the National Bank of Moldova!
×
Do you have good eyesight and want to turn this tool off?


Welcome to the official website of the National Bank of Moldova!
You can choose one of the most popular reports from the list:

National Bank and the members of its decision-making bodies shall be independent in exercising the tasks conferred upon them by law, and shall neither seek nor take instructions from public authorities or from any other authority.

In order to ensure and maintain price stability over the medium term, the National Bank’s aim will be to keep inflation (measured by Consumer Price Index) at the level of 5.0 percent annually with a possible deviation of ± 1.5 percentage points, considered to be optimal for growth and development of Moldova's economy over the medium-term.

Financial stability is achieved by strengthening the resilience of the financial system, limiting the contagion effect and reducing the accumulation of systemic risks, thus contributing to the sustainability of the financial sector and economic growth.

National Bank shall have the exclusive right to issue on the territory of the Republic of Moldova banknotes and coins as legal tender, as well as commemorative and jubilee banknotes and coins as legal tender and for numismatic purposes.

National Bank is exclusively responsible for the licencing, supervision and regulation of financial institutions activity.

National Bank of Moldova acts as banker and fiscal agent of the State and shall receive from state bodies economic and financial information and documents, which are necessary for carrying out its tasks.

National Bank of Moldova is an autonomous public legal entity and is responsible to the Parliament.

National Bank shall inform the public on the monetary policy strategy on the results of the macroeconomic analysis, the evolution of the financial market and on statistics, including with regard to monetary supply, crediting, balance of payments and the state of the foreign exchange market.

National Bank of Moldova is responsable for the compilation of the balance of payments, international investment position and the statistics of the external debt of the Republic of Moldova.
Inflation Report no.2, May 2013
Yield curves play an important role, both theoretical and practical, in determining the interest rate’s level.
The yield curve is a continuous curve, which describes the functional relationship between yield to maturity and the number of years that occur before maturity for fixed-income securities at a given moment. Equal claims from other points of view (repayment risk, liquidity risk, purchase price, etc.) are also included and represented. Although the yield curves are limited only to certain claims, these are also significant for the entire credit market.
In the U.S. the subject to such representations is the treasury bills, while in the Republic of Moldova - state securities.
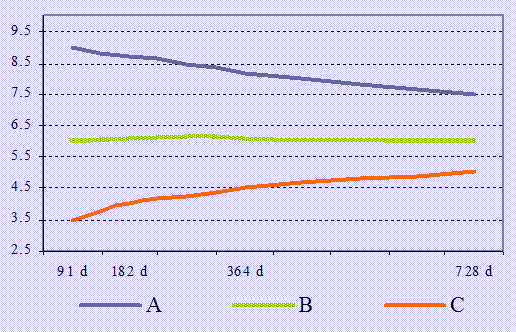
According to the current conjuncture, yield curves can have three ways of expression:
The Flat Yield Curve indicates that the bond yields on short, medium and long term are practically the same and therefore the relationship between supply and demand is balanced on the whole market (Chart no.1, curve B).
The Upward-Sloping Yield Curve shows that long-term securities have a high yield and suggests that the demand for short-term funds is very strong (relative to supply) compared to demand for long-term funds (Chart no.1, curve C).
The Downward-Sloping Yield Curve shows that the short-term securities have a very high yield, which means that the demand for long-term funds is very strong (relative to supply) compared to the demand for short-term funds (Chart no.1, curve A).
For the explanation of the yield curve configurations there were submitted three hypotheses:
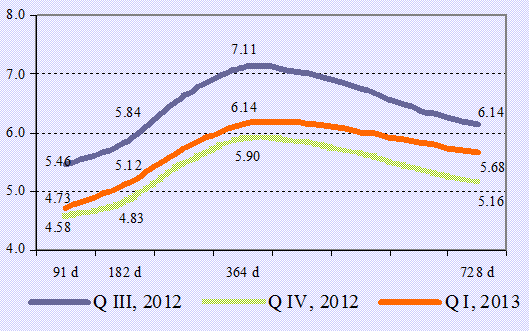
In the Republic of Moldova (Chart no.2), the SS yield curve has a convex shape, which shows that the yields for these maturities are higher. This occurs due to the fact that the state securities market is segmented according to the preferences of investors. Most of them are licensed banks that prefer to invest in SS with lower maturity, which are considered to be more liquid, but also the Ministry of Finance’s offer is mostly oriented towards treasury bills.
Typically, at an auction per month, licensed banks purchase government bonds with a maturity of two years, but both the offer of the Ministry of Finance and the demand are much smaller than for the treasury bills. Thus, the market is segmented as follows: the first segment - treasury bills from 91 days to 364 days and the second segment - government bonds with a maturity of two years. The volume traded on these segments differs, the first segment - about 99.0 percent of all transactions in the securities market, while the volume of bonds with maturity of 2 years - 1.0 percent of the total. In addition, interest rates on bonds of 2 years can be explained by the expectations hypothesis. Most likely, the investors expect a decrease in interest and inflation for this type of SS.