Welcome to the official website of the National Bank of Moldova!
×
Do you have good eyesight and want to turn this tool off?


Welcome to the official website of the National Bank of Moldova!
You can choose one of the most popular reports from the list:

National Bank and the members of its decision-making bodies shall be independent in exercising the tasks conferred upon them by law, and shall neither seek nor take instructions from public authorities or from any other authority.
In order to ensure and maintain price stability over the medium term, the National Bank’s aim will be to keep inflation (measured by Consumer Price Index) at the level of 5.0 percent annually with a possible deviation of ± 1.5 percentage points, considered to be optimal for growth and development of Moldova's economy over the medium-term.

Financial stability is achieved by strengthening the resilience of the financial system, limiting the contagion effect and reducing the accumulation of systemic risks, thus contributing to the sustainability of the financial sector and economic growth.

National Bank shall have the exclusive right to issue on the territory of the Republic of Moldova banknotes and coins as legal tender, as well as commemorative and jubilee banknotes and coins as legal tender and for numismatic purposes.

National Bank is exclusively responsible for the licencing, supervision and regulation of financial institutions activity.

National Bank of Moldova acts as banker and fiscal agent of the State and shall receive from state bodies economic and financial information and documents, which are necessary for carrying out its tasks.
National Bank of Moldova is an autonomous public legal entity and is responsible to the Parliament.

National Bank shall inform the public on the monetary policy strategy on the results of the macroeconomic analysis, the evolution of the financial market and on statistics, including with regard to monetary supply, crediting, balance of payments and the state of the foreign exchange market.

National Bank of Moldova is responsable for the compilation of the balance of payments, international investment position and the statistics of the external debt of the Republic of Moldova.
Table 1. Main macroeconomic indicators of the Republic of Moldova
|
|
UM |
Q I 2013 |
Q II 2013 |
Q III 2013 |
Q IV 2013 |
Q I 2014 |
|
Gross domestic product in current prices |
MDL million |
19,673 |
23,703 |
29,936 |
26,567 |
21,469 |
|
Period average exchange rate |
MDL / USD |
12.1855 |
12.3834 |
12.7675 |
13.0153 |
13.3875 |
|
Current account / GDP |
% |
-7.1 |
-10.8 |
-2.0 |
-0.7 |
-5.9 |
|
Compensation of employees and personal transfers / GDP |
% |
24.7 |
25.5 |
23.3 |
26.5 |
24.2 |
|
Balance of goods and services / GDP |
% |
-39.1 |
-41.7 |
-31.7 |
-39.6 |
-38.6 |
|
Exports of goods and services / Imports of goods and services |
% |
56.5 |
50.2 |
54.6 |
54.8 |
56.5 |
|
Average export propensity index (goods and services / GDP) |
% |
50.9 |
42.1 |
38.1 |
48.0 |
50.2 |
|
Average import propensity index (goods and services / GDP) |
% |
90.0 |
83.8 |
69.7 |
87.5 |
88.7 |
|
Foreign direct investment in domestic economy, net flow / GDP |
% |
3.3 |
3.7 |
2.0 |
3.0 |
1.1 |
Chart 1. Balance of payments components, quarterly dynamics (US$ million)
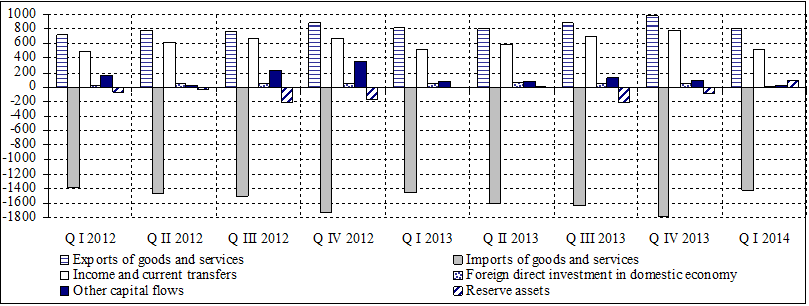
Table 2. Main macroeconomic indicators of international investment position and external debt
|
|
UM |
End of 2010 |
End of 2011 |
End of 2012 |
End of 2013 |
End of Q I 2014 |
|
Net international investment position |
US$ million |
-4,187.59 |
-4,805.99 |
-5,030.45 |
-5,345.01 |
-5,482.43 |
|
Stock of foreign assets / Stock of foreign liabilities |
% |
39.6 |
38.6 |
41.5 |
43.1 |
42.7 |
|
Foreign direct investment in domestic economy, stock |
US$ million |
2,964.45 |
3,261.06 |
3,446.93 |
3,668.27 |
3,677.57 |
|
Stock of reserve assets / Imports of goods and services month average (per year) |
month |
4.5 |
3.9 |
4.9 |
5.2 |
5.1 |
|
Stock of reserve assets / short-term external debt |
% |
113.1 |
107.5 |
129.9 |
121.5 |
109.8 |
|
External debt |
US$ million |
4,711.10 |
5,358.91 |
5,983.76 |
6,612.68 |
6,754.03 |
|
Publicly and publicly guaranteed external debt |
US$ million |
1,348.68 |
1,521.35 |
1,762.56 |
1,774.92 |
1,775.35 |
|
Non-guaranteed private debt |
US$ million |
3,362.42 |
3,837.56 |
4,221.19 |
4,837.77 |
4,978.68 |
|
Share of long-term external debt in gross external debt |
% |
67.8 |
65.9 |
67.6 |
64.9 |
63.2 |
|
Short term external debt |
US$ million |
1,518.20 |
1,827.90 |
1,936.80 |
2,321.27 |
2,483.80 |
Details on international accounts evolution (balance of payments, international investment position and external debt) can be found in analytical materials published on the official website of NBM
Balance of payments for quarter I, 2014 (preliminary data)
International investment position at the end of quarter I, 2014 (preliminary data)
External debt at the end of quarter I, 2014
Statistical series on balance of payments (from 1995), international investment position (from 1998) and external debt (from 2000) can be found on the official website of NBM:


