Welcome to the official website of the National Bank of Moldova!
×
Do you have good eyesight and want to turn this tool off?


Welcome to the official website of the National Bank of Moldova!
You can choose one of the most popular reports from the list:

National Bank and the members of its decision-making bodies shall be independent in exercising the tasks conferred upon them by law, and shall neither seek nor take instructions from public authorities or from any other authority.
In order to ensure and maintain price stability over the medium term, the National Bank’s aim will be to keep inflation (measured by Consumer Price Index) at the level of 5.0 percent annually with a possible deviation of ± 1.5 percentage points, considered to be optimal for growth and development of Moldova's economy over the medium-term.

Financial stability is achieved by strengthening the resilience of the financial system, limiting the contagion effect and reducing the accumulation of systemic risks, thus contributing to the sustainability of the financial sector and economic growth.

National Bank shall have the exclusive right to issue on the territory of the Republic of Moldova banknotes and coins as legal tender, as well as commemorative and jubilee banknotes and coins as legal tender and for numismatic purposes.

National Bank is exclusively responsible for the licencing, supervision and regulation of financial institutions activity.

National Bank of Moldova acts as banker and fiscal agent of the State and shall receive from state bodies economic and financial information and documents, which are necessary for carrying out its tasks.
National Bank of Moldova is an autonomous public legal entity and is responsible to the Parliament.

National Bank shall inform the public on the monetary policy strategy on the results of the macroeconomic analysis, the evolution of the financial market and on statistics, including with regard to monetary supply, crediting, balance of payments and the state of the foreign exchange market.

National Bank of Moldova is responsable for the compilation of the balance of payments, international investment position and the statistics of the external debt of the Republic of Moldova.
In the second quarter of 2018, the total amount of money transfers from abroad made in favour of individuals of the Republic of Moldova amounted to USD 342.59 million. It should be mentioned that a share of 84.8 percent of money was transferred via money remittance systems (in USD, EUR and RUB), mainly without opening bank accounts, whereas 15.2 percent represented bank transfers (in different currencies) carried out via the SWIFT system, presented in gross settlements.
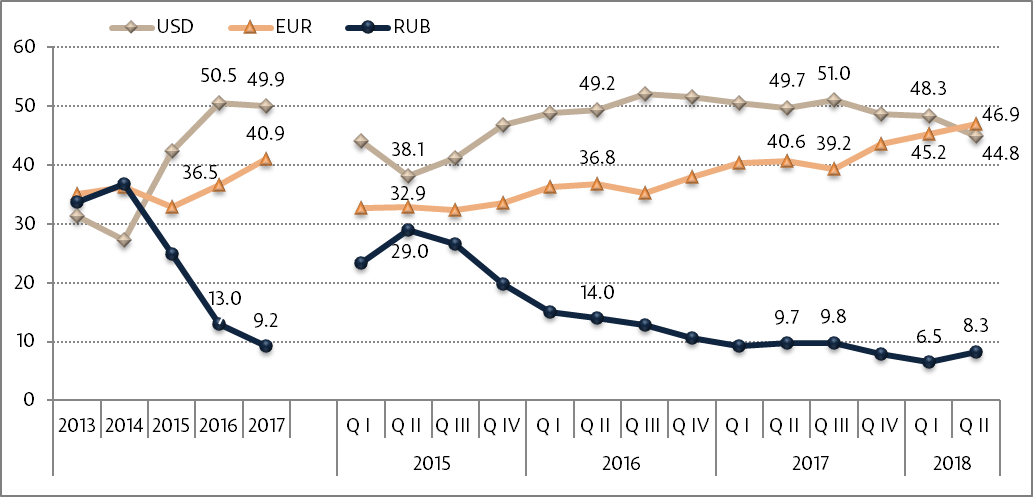
In the second quarter of 2018, the amount of transfers, recalculated in USD, increased by 14.2 percent, compared to the second quarter of 2017 (USD 299.89 million). The fluctuations in the exchange rate of original currencies against the U.S. dollar (Chart no.1) contributed by 4.9 percentage points to the increase in the value of transfers in the second quarter of 2018. However, the effective increase of transfers was 9.3 percent, being eliminated the exchange rate effect through the recalculation of amounts at the exchange rate for the respective period of the previous year. This occurred as a result of the impact of decrease in transfers in RUB by 3.1 % and the increase in transfers in EUR and USD by 30.6 percent and 2.8 percent, respectively. Thus, in the second quarter of 2018, the currency structure of transfers (recalculated in USD) was the following: USD - 146.86 million, EUR - 167.93 million, RUB - 24.58 million and other currencies 3.22 million. Chart no. 1 shows the impact of the USD/EUR and USD/RUB exchange rate’s modification on the volume of monthly transfers in favour of individuals.
Chart no. 1.
The evolution of USD/EUR and USD/RUB exchange rate impact on transfers in 2013 - 2018 years (US$ mil.)
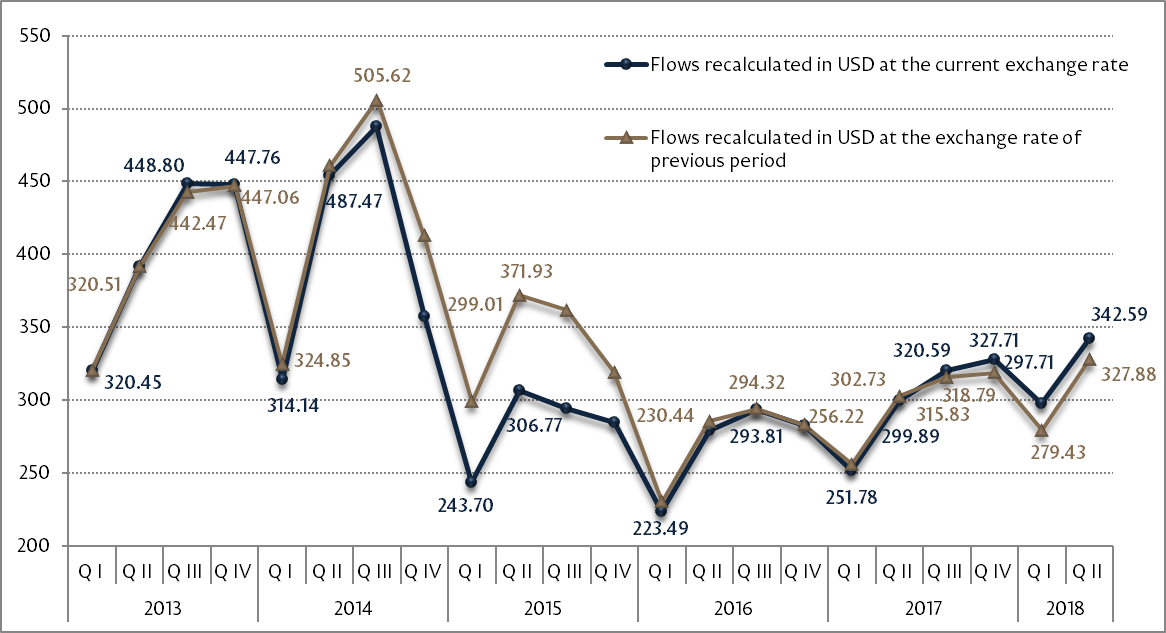
SOURCE: International banking operations statistics of the NBM
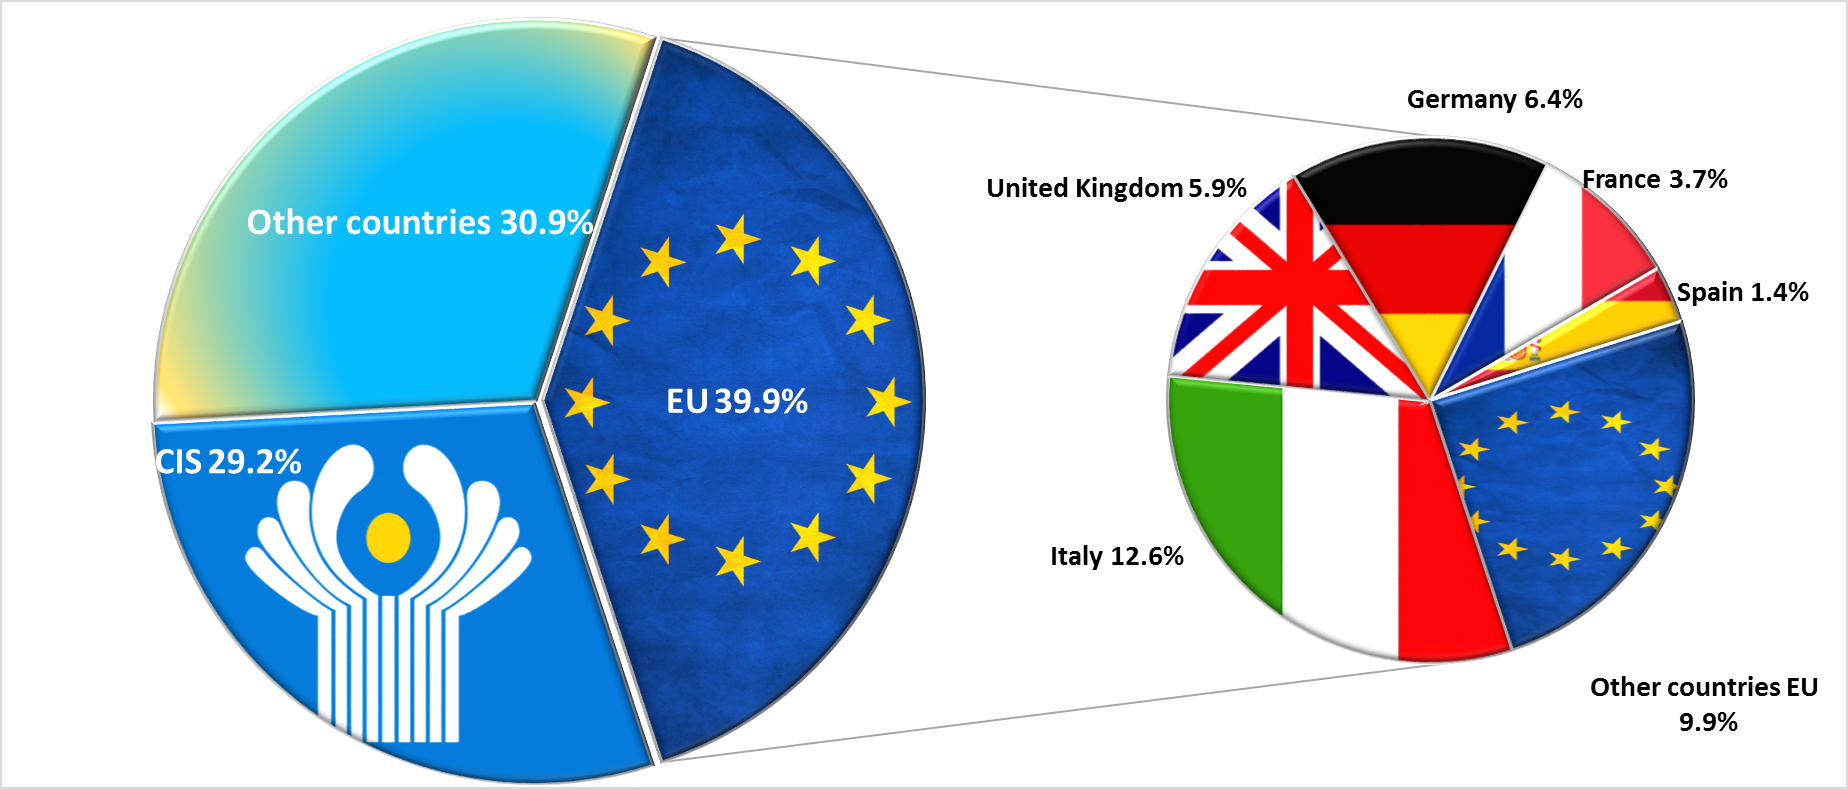
In terms of the geographical origin of money transfers from abroad in favour of individuals, the EU and the CIS are to be mentioned as the main areas generating remittances (Chart no.2). Money transfers from EU held a share of 39.9 percent, having increased by 6.2 percentage points compared to the second quarter of 2017. Money transfers from the CIS region accounted for a share of 29.2 percent, having decreased by 7.1 percentage points compared to the second quarter of 2017. The transfers from other countries, excepting the EU and CIS, accounted for 30.9 percent in the second quarter of 2018 and 30.0 percent in the second quarter of 2017, respectively. In the second quarter of 2018 and 2017, the share of transfers from Israel, USA and Turkey recorded 87.0 and 85.8 percent, respectively, of total transfers from other countries.
Chart no. 2.
Dynamics of transfers from the EU and CIS in favour of individuals, (2013-2017 - annual dynamics; 2015-2018 - quarterly dynamics), %
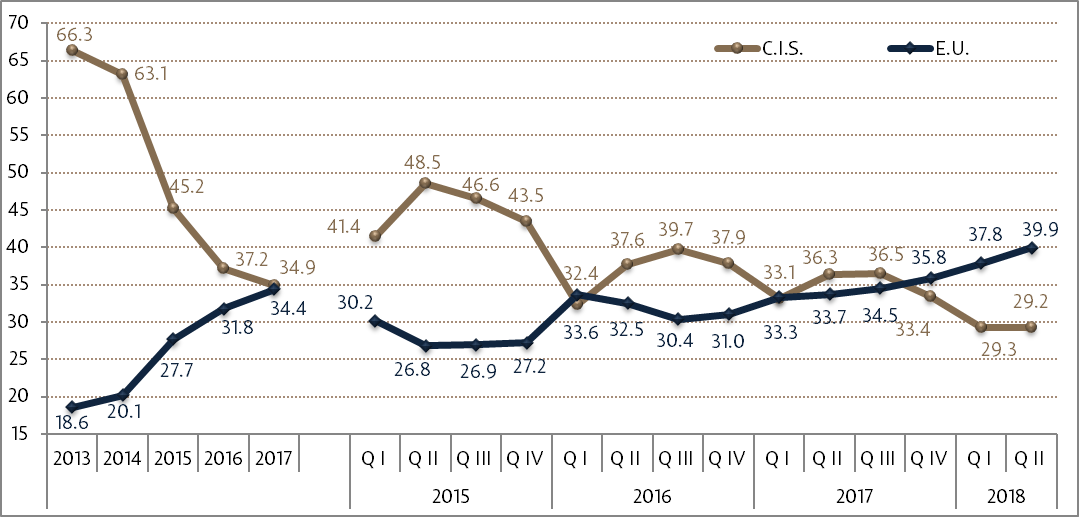
SOURCE: International banking operations statistics of the NBM
Money transfers from the Russian Federation held the largest share of 96.5 percent of total transfers from the CIS. Transfers from other CIS countries had the following shares: Ukraine - 1.4 percent, Kazakhstan - 0.7 percent, Belarus - 0.4 percent, Uzbekistan - 0.4 percent, Azerbaijan - 0.3 percent and other CIS countries - 0.3 percent.
Among the transfers from the EU, transfers from Italy held the largest share of 31.5 percent, being followed by transfers from Germany (16.0 percent), United Kingdom (14.7 percent), France (9.2 percent), Spain (3.4 percent), Ireland (3.1 percent), Czech Republic (3.0 percent), Portugal (2.7 percent), Romania (2.5 percent), Belgium (2.3 percent), Poland (2.1 percent), Cyprus (1.4 percent) and Greece (1.2 percent).
Chart no. 3.
Geographical structure of money transfers (main countries) in favour of individuals in the second quarter of 2018, %
SOURCE: International banking operations statistics of the NBM
The distribution by countries of money transfers from abroad in favour of individuals (Chart no.3) showed that the Russian Federation held the share of 28.2 percent (USD 96.60 million) of total transfers (having decreased by 6.8 percentage points as compared to the second quarter of the previous year). It should be noted that 98.1 percent of total transfers from the Russian Federation were carried out through money transfer systems, the remaining 1.9 percent of transfers being performed as bank transfers via SWIFT. At the same time, it should be mentioned the money transfers from Israel - 17.7 percent (USD 60.60 million), from Italy - 12.6 percent (USD 43.03 million), USA - 8.1 percent (USD 27.87 million), Germany - 6.4 percent (USD 21.82 million), United Kingdom - 5.9 percent (USD 20.13 million), France - 3.7 percent (USD 12.52 million), Spain - 1.4 percent (USD 4.63 million), Czech Republic - 1.2 percent (USD 4.10 million), Portugal - 1.1 percent (USD 3.64 million), Turkey - 1.0 percent (USD 3.52 million), Romania - 1.0 percent (USD 3.45 million), Belgium - 0.9 percent (USD 3.10 million), Poland - 0.8 percent (USD 2.86 million), Cyprus - 0.5 percent (USD 1.87 million), Canada - 0.5 percent (USD 1.74 million), United Arab Emirates - 0.4 percent (USD 1.54 million), Ukraine - 0.4 percent (USD 1.40 million), and Kazakhstan - 0.2 percent (USD 0.71 million) should be noted. The transfers from the above nineteen countries (including Russia) amounted for 92.0 percent (315.13 USD million) of total transfers to the Republic of Moldova.
Chart no. 4.
Dynamics of transfers (top three countries) in favour of individuals (2013-2017 - annual dynamics; 2015-2018 – quarterly dynamics), %
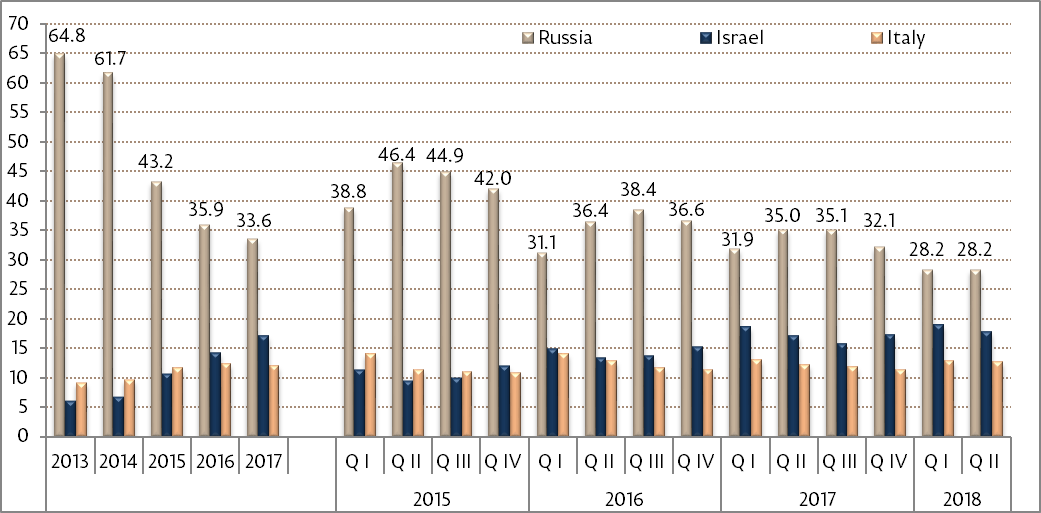
SOURCE: International banking operations statistics of the NBM
The quarterly share of transfers in RUB via MTS recorded a steady downward trend, having decreased from 29.0 percent in the second quarter of 2015 to 6.5 percent in the first quarter of 2018 and an increase to 8.3 percent in the second quarter of 2018. The share of transfers in USD recorded an upward trend, having increased from 38.1 percent in the second quarter of 2015 to 51.0 percent in the third quarter of 2017 and a decrease to 44.8 percent in the second quarter of 2018.
Chart no. 5.
Currency structure of money transfers from abroad in favour of individuals via money transfer systems (2013-2017 - annual dynamics; 2015-2018 - quarterly dynamics), %
SOURCE: International banking operations statistics of the NBM
In the second quarter of 2018, as compared to the same period of the previous year, the quarterly share of transfers in EUR (recalculated in USD) increased by 6.3 percentage points, to 46.9 percent, while the quarterly share of transfers in USD and RUB (recalculated in USD) decreased by 4.9 percentage points, to 44.8 percent, and by 1.4 percentage points, to 8.3 percent, respectively. Thus, the share of transfers in EUR recorded an upward trend, having increased from 32.9 percent in the second quarter of 2015 to 46.9 percent in the second quarter of 2018 (Chart no.5).
Chart no. 6.
Currency structure of money transfers via money transfer systems from the Russian Federation, recalculated in USD, in the second quarter of the years 2014 - 2018, %
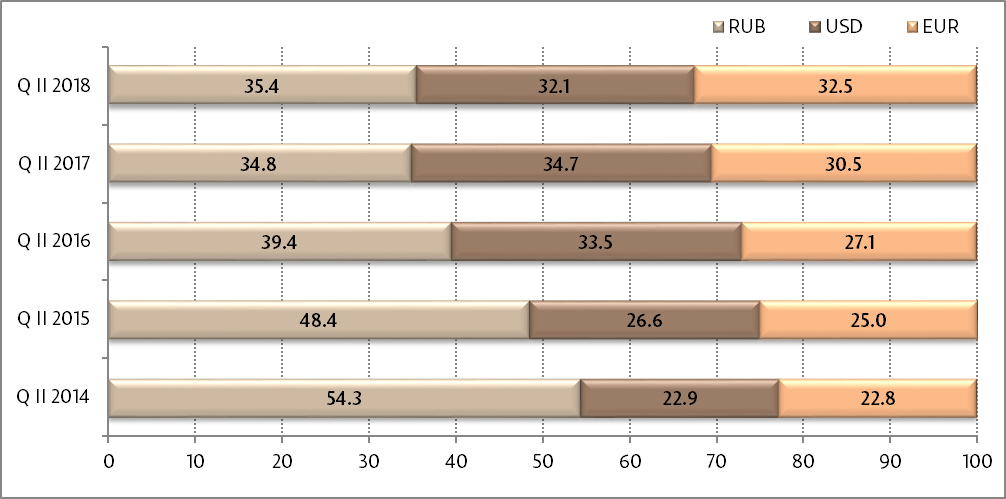
SOURCE: International banking operations statistics of the NBM
In the second quarter of 2018, the transfers from the Russian Federation via MTS (Chart no.6), in quarterly average values (recalculated in USD), consisted of: transfers in RUB holding a share of 35.4 percent, transfers in EUR - 32.5 percent, and the transfers in USD - 32.1 percent. During 2014 - 2018, the share of transfers in EUR from Russian Federation recorded a steady increase, growing from 22.8 percent in the second quarter of 2014 to 32.5 percent in the second quarter of 2018.
NOTE:
The National Bank of Moldova notes that money transfers from abroad in favour of individuals via banks do not consist solely of remittances of Moldovan citizens working abroad, but also include unilateral transfers such as:
Money transfers from abroad in favour of individuals through Moldovan banks also include transfers of individuals made via postal offices of the State Enterprise "Poşta Moldovei" (settled through banks), both via MTS and money orders.
Note that this indicator does not include:
a) international transfers to individuals made via SWIFT payment system with an investment purpose (with significant values), which amounted to USD 3.70 million in the second quarter of 2018;
b) international transfers via SWIFT payment system to non-resident individuals, clients of licensed Moldovan banks;
c) transfers made via banks located in the Transnistrian region of the Republic of Moldova.
Publication of data is only allowed if a reference to this page is provided.


